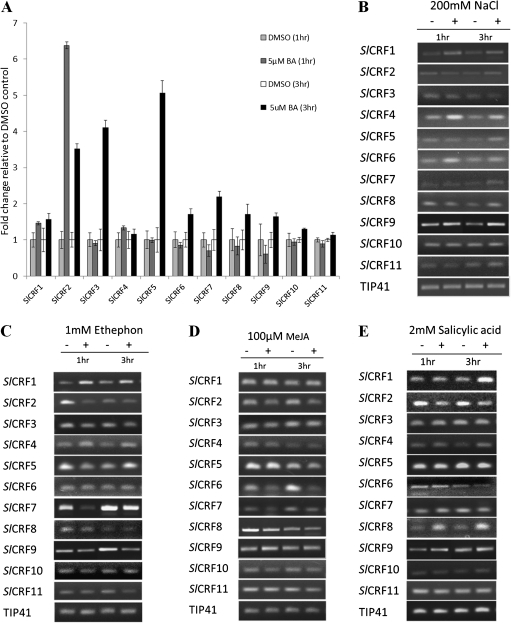
Fig. 3.
Expression response of SlCRF genes to hormones and salt. Relative expression in 15-day-old leaves of SlCRF1–SlCRF11 in response to hormone or salt treatment at 1 h and 3 h after treatment versus non-treated controls. (A) qRT-PCR of cytokinin (5 μM BA) treatment. Data presented are a mean±SE (two biological replicates). Light grey bar, 1 h DMSO control; dark grey bar, 1 h BA treatment; white bar, 3 h DMSO control; black bar, 3 h BA treatment. (B) RT-PCR of salt (200 mM NaCl) treatment. (C) RT-PCR of ethylene (1 mM Ethephon) treatment. (D) RT-PCR of methyl jasmonate (100 μM MeJA) treatment. (E) RT-PCR of salicylic acid (2 mM SA) treatment. Data presented for RT-PCR are from a representative sample of experiments, with the TIP41 gene serving as an internal control.

