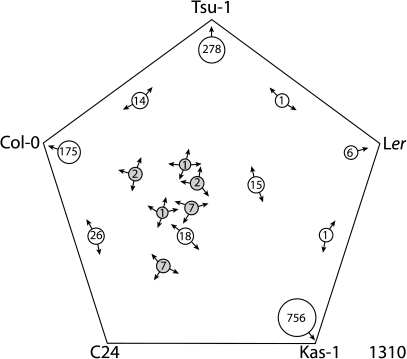
Fig. 3.
Five-way generalized Venn diagram of Fe-deficiency-downregulated genes from A. thaliana ecotypes Tsu-1, Kas-1, Ler, Col-0, and C24. Arrows on the circles indicate ecotypes in which genes of that set were significantly downregulated. Common gene sets are shaded. Total number of genes for all ecotypes is indicated in the lower right corner.

