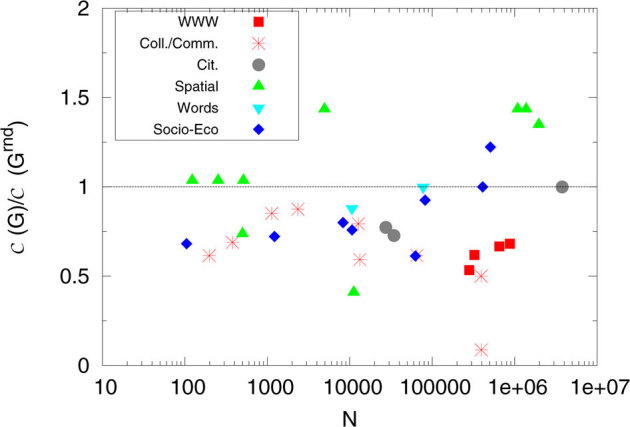
Figure 3. Relative size of the minimum controlling set in various real systems.

We report, as a function of N, the ratio between the sizes of the minimum controlling set in real networks and in their respective randomized versions (we have considered averages over 100 different realizations). Different symbols and colors refer to the six network classes considered in Table 1. The observed ratio is lower than 1 in most of the cases, with the smallest values corresponding to collaboration/communication systems, WWW and socio-economical networks. The ratio is equal to 1 in three cases. The networks with ratio larger than 1, with the exception of one socio-economical system (namely Epinions), are all spatially constrained systems: three electronic circuits, the US power grid, and three road networks.
