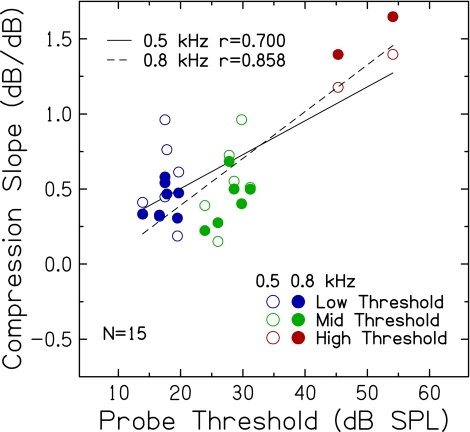
FIG. 6.
Compression slope estimates for 0.5-kHz (open) and 0.8-kHz (filled) off-frequency maskers plotted against probe threshold. To minimize variance, inferred input–output responses included all (6 to 8) threshold estimates from trial 1 and trial 2 for each on-frequency masker-probe interval. Pearson correlation coefficients and linear regression functions are included.

