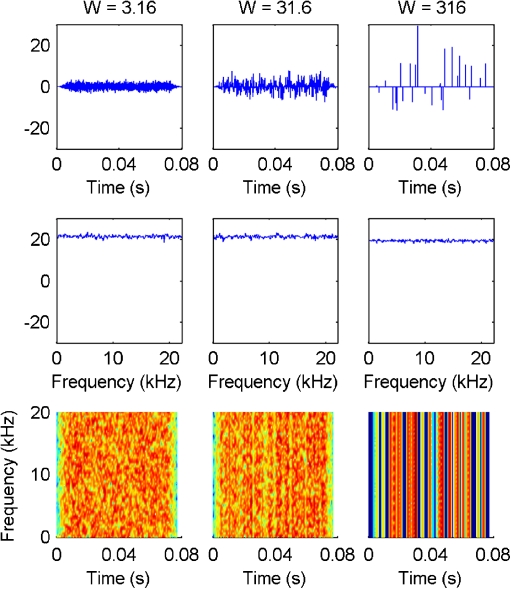
FIG. 1.
Waveforms (upper row), power spectra (middle row), and spectrograms (lower row) of sparse noise as a function of different degrees of power fluctuations (W). All three stimuli share the same long-term power spectrum and the same RMS. The increase in W is reflected in the emergence of vertical stripes in the spectrogram. The color code in the spectrograms spans a range from 0 dB (blue) to 50 dB (red).

