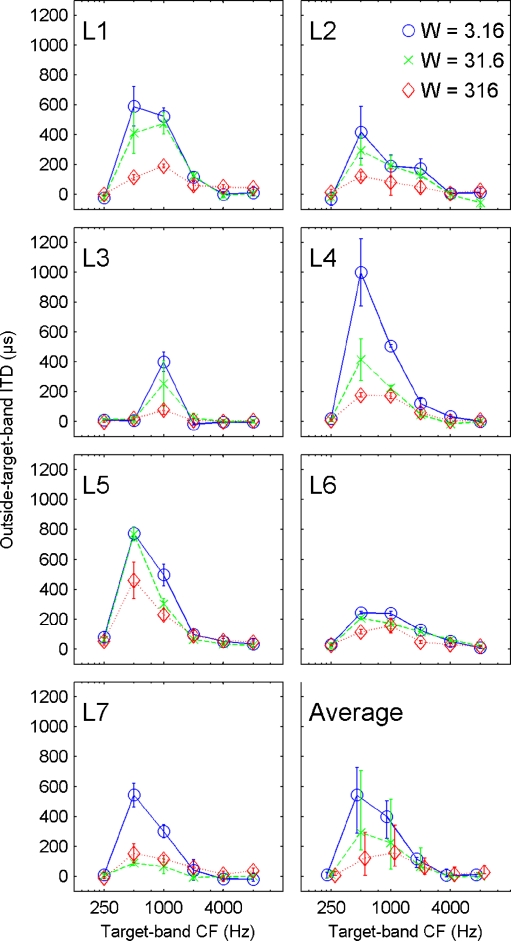
FIG. 4.
Spectral dominance of ITD extraction and the effect of W. Each panel shows the left-ward ITD in the outside-target-band frequency range around the CF to perceptually compensate for a right-ward ITD in the band-pass frequency range around the same CF (target band). Data are shown for three values of W, 3.16 (blue, open circles and solid lines), 31.6 (green, x symbols and dashed lines), and 316 (red, open diamonds and dotted lines). The figure shows both individual data (VP1–7) and the average data (lower right panel, median and interquartile ranges). For each listener, the required outside-target-band ITD to compensate for a target-band ITD is highest for target bands around 500 or 1,000 Hz, indicating that this frequency range dominates ITD extraction. This low-frequency dominance, however, appears to decrease systematically with increasing W. In the average data, this decrease is significant for a CF of 1 kHz (Kruskal–Wallis, df = 2, χ2 = 9.24, p < 0.01).

