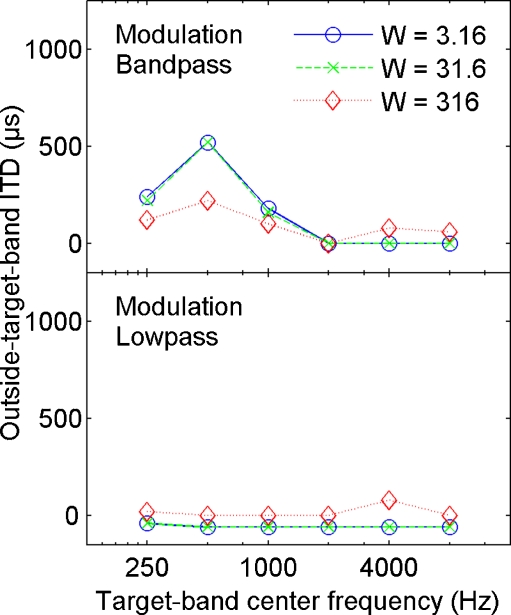
FIG. 6.
Simulation of the spectral dominance experiment (experiment II). Upper and lower panels are for the modulation bandpass and lowpass model, respectively. In qualitative agreement with the experimental data (cf. Fig. 4, lower right), the modulation bandpass model predicts the largest outside-target-band ITDs to compensate a target-band ITD applied at 500 Hz. The model also predicts that this required outside-target-band ITD decreases with increasing W of the stimuli, at least when W increases from 31.6 to 316. The modulation lowpass model in the lower panel fails to account for the data.

