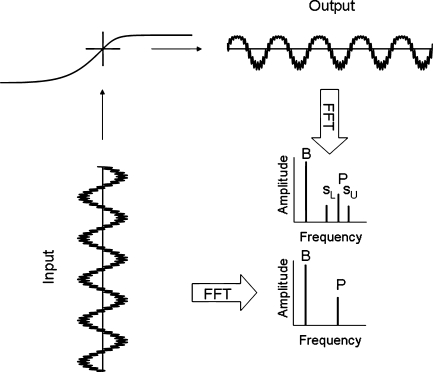
FIG. 1.
The essence of our modeling efforts for one level of a low-frequency bias tone. In the lower left, a low-frequency bias tone and higher frequency probe tone are shown as mechanical input to the model transducer function in the upper left. The model transducer function represents the outer hair cell input–output function with mechanical drive on the x-axis and outer hair cell current on the y-axis. The output in the upper right shows distortion in the time domain. The lower right illustrates that the output in the frequency domain has a bias tone (B), probe tone (P), and lower and upper sidebands (sL and sU). In contrast, the input has no sidebands.

