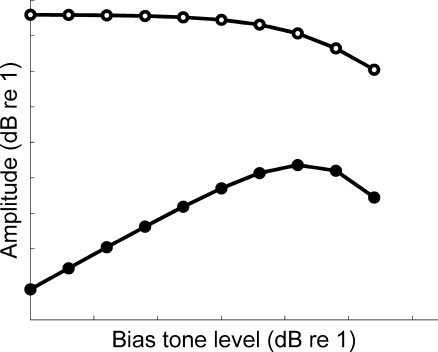
FIG. 2.
Amplitude of modeled sidebands (filled symbols) and probe output (open symbols) as a function of bias tone level. The sidebands resulted from amplitude modulation of the probe tone. The sideband growth was governed by the gain, or slope, of the transducer function. The decline of the sidebands, as well as the probe tone at the output, was also governed by the morphology of the transducer function. This is a guide to our interpretation of our physiologic SFOAE biasing experiment described below.

