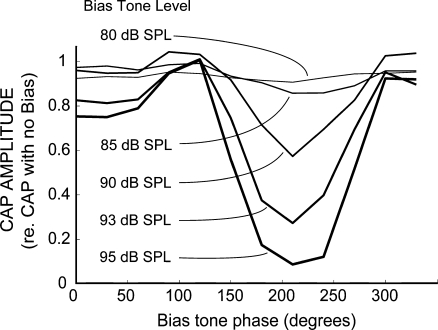
FIG. 6.
Example cat CAP amplitude as a function of bias tone phase and level. Lines connect CAP peak-to-peak amplitude measures obtained from different levels and phases of the bias tone. The lines thicken slightly to help illustrate increasing bias level. The amount of CAP suppression varied with the level and phase of the bias tone. For this example, 50% suppression occurred at a bias tone level of 91 dB SPL and phase of 210°. The tone-pip frequency was 6.399 kHz.

