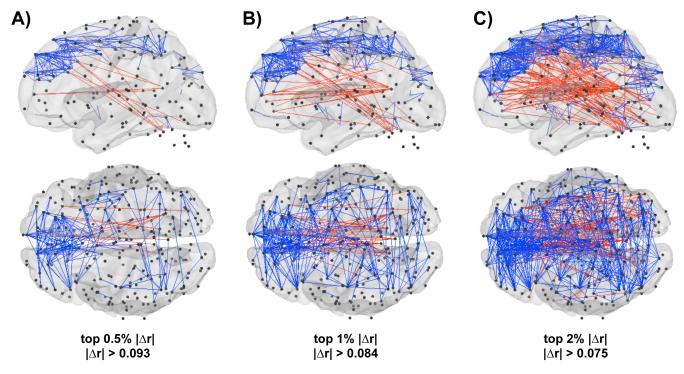
Figure 6. The spatial distribution of scrubbing effects upon correlations.
The top 0.5% (A) and 1% (B), and 2% (C) of Δr changes, as indexed by the absolute value of the change. Blue vectors represent correlations that decrease with scrubbing, and red vectors are correlations that increase with scrubbing. Most blue vectors are short- to medium-range, while most red vectors are medium- to long-range. The locations of the 264 ROIs are shown as small black spheres. Data are shown on a transparent PALS fiducial surface (Van Essen, 2005), and cerebellar ROIs are shown without a cerebellar surface.

