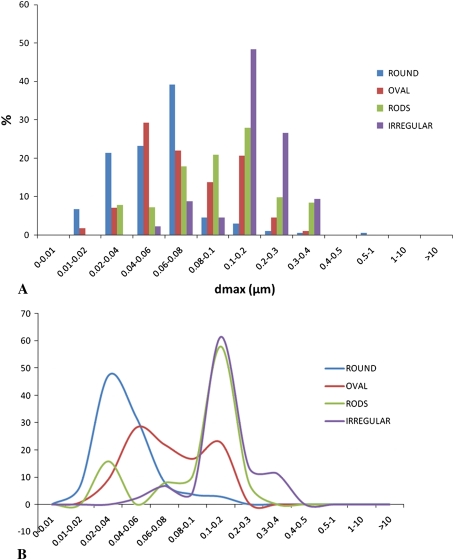
Fig. 10A–B.
Graphs show shape distribution as a function of maximum Feret’s diameter (dmax) for a typical MOM sample. Particle shapes were automatically extracted via a dedicated algorithm and could be associated to any other parameter. (A) A distribution of dmax for various shapes is shown. (B) Peaks in the distribution of particles with various shapes are more readily identified in this line graph; round particles are usually the smallest particles whereas irregular particles are larger; oval particles and rods are more dispersed across the entire spectrum.

