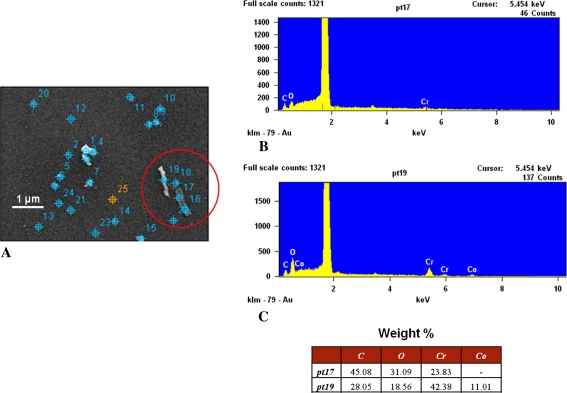
Fig. 11A–C.
Images show the chemical characterization of particles on a wafer. (A) On a low-resolution image of the analyzed wafer area acquired via EDS software, particles were automatically identified (marked on the image) and numbered; some particles cannot be distinguished from the marks because of the low resolution and small particle dimension. Spectra are shown from the particles in the circle in (A), specifically from (B) Point 17, which is a Co-rich particle and dark, and (C) Point 19, which is from a particle mainly composed of CrOx and bright.

