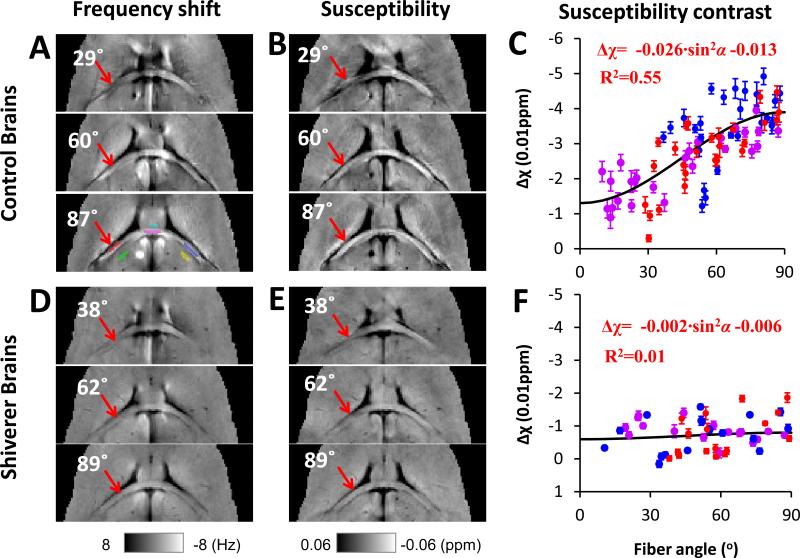
Fig. 2. Orientation dependence of AMS in normal and dysmyelinating shiverer mice.
A and D: frequency maps from 3 selected brain orientations. A representative selection of ROI is shown in the lower panel of A. ROIs in the white matter are labeled by red, magenta, and blue colors; ROIs in the corresponding adjacent gray matter are labeled by green, cyan, and yellow colors. B and E: AMS corresponding to the frequency shifts shown in A and D. C and F: AMS difference between white and gray matter. All data points are shown as mean ± standard error. Susceptibility anisotropy is observed in the control mice but not in shiverer mice. The angles shown on the images are the angles between the directions of the white matter segment (red ROI pointed by a red arrow) determined by DTI and the main field, e.g., 0° means that the selected fiber segment is parallel to the main magnetic field. The ROI color in panel A corresponds to the data point color in panel C and F.

