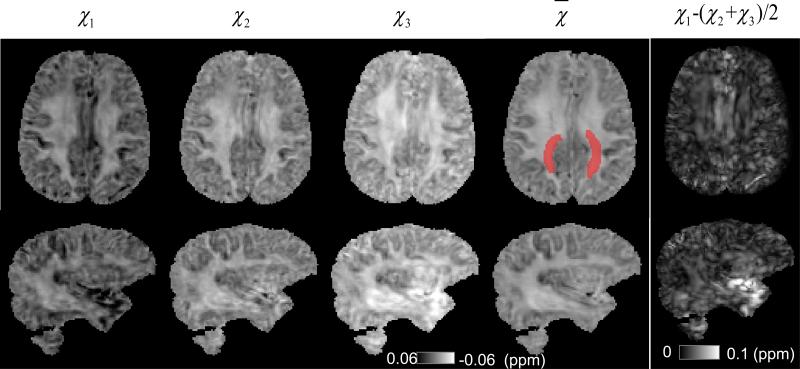
Fig. 5. Principal, mean susceptibilities and susceptibility anisotropy in the human brain.
The three principal susceptibilities of the same two slices in Fig. 4 are shown from left to right in a descending order. The increasing image intensity show strong susceptibility anisotropy in the white matter. A reduced level anisotropy is also observed in the gray matter. The region in mean susceptibility map labeled with red color is used for calculation of susceptibility anisotropy.

