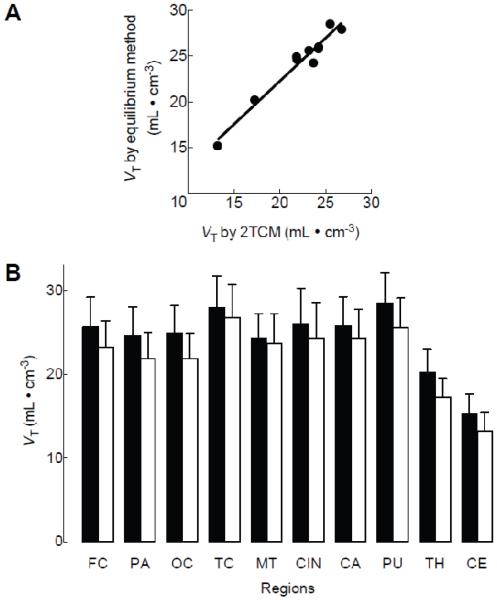
Figure 4. Comparison of total distribution volume (VT) in various brain regions.
VT values were calculated by the equilibrium method and an unconstrained two-tissue compartment model in nine subjects injected with 18F-SP203 as bolus plus constant infusion. Scatterplots compare mean VT values from each region measured by the equilibrium method vs. the two-tissue compartment model (2TCM) (A). The simple linear regression showed significant correlation (R2 = 0.95, p < 0.0001). (B) Mean VT values obtained via the equilibrium method (filled bars) were significantly higher than those obtained via the two-tissue compartment model (open bars) (p < 0.05 by repeated-measures analysis of variance). Data represent mean ± SD of all nine subjects. FC: frontal cortex, PA: parietal cortex, OC: occipital cortex, TC: temporal cortex, MT: medial temporal cortex, CIN: cingulate cortex, CA: caudate cortex, PU: putamen, TH: thalamus, CE: cerebellum.

