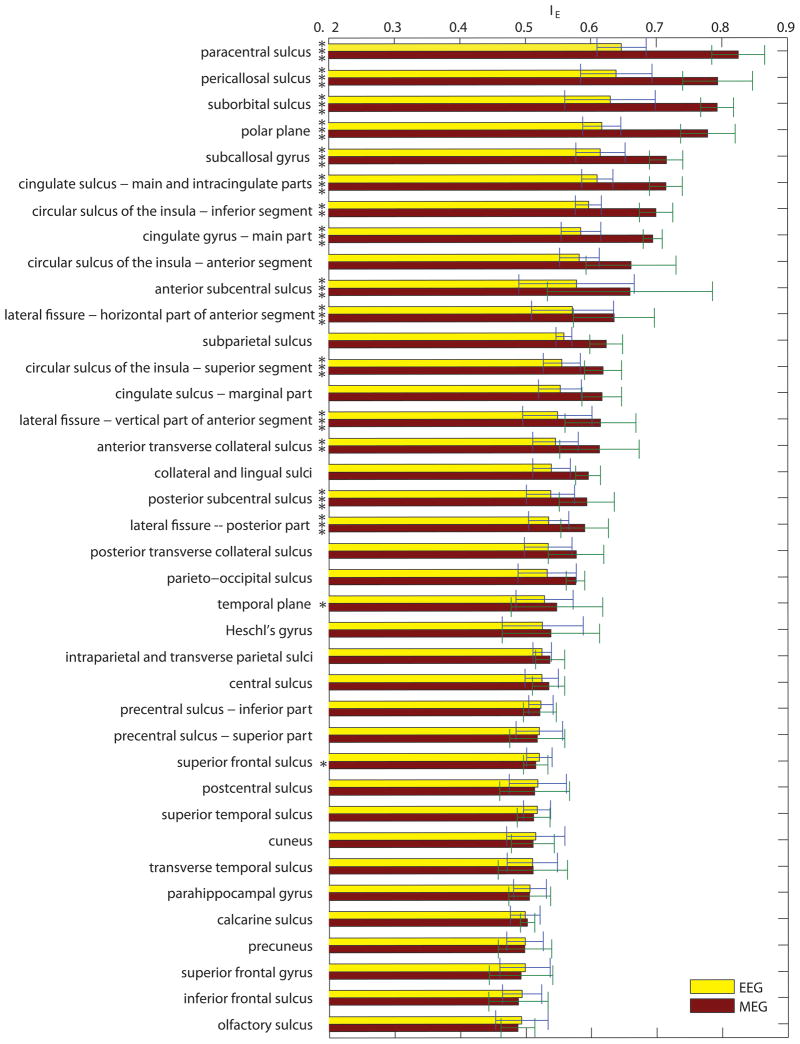
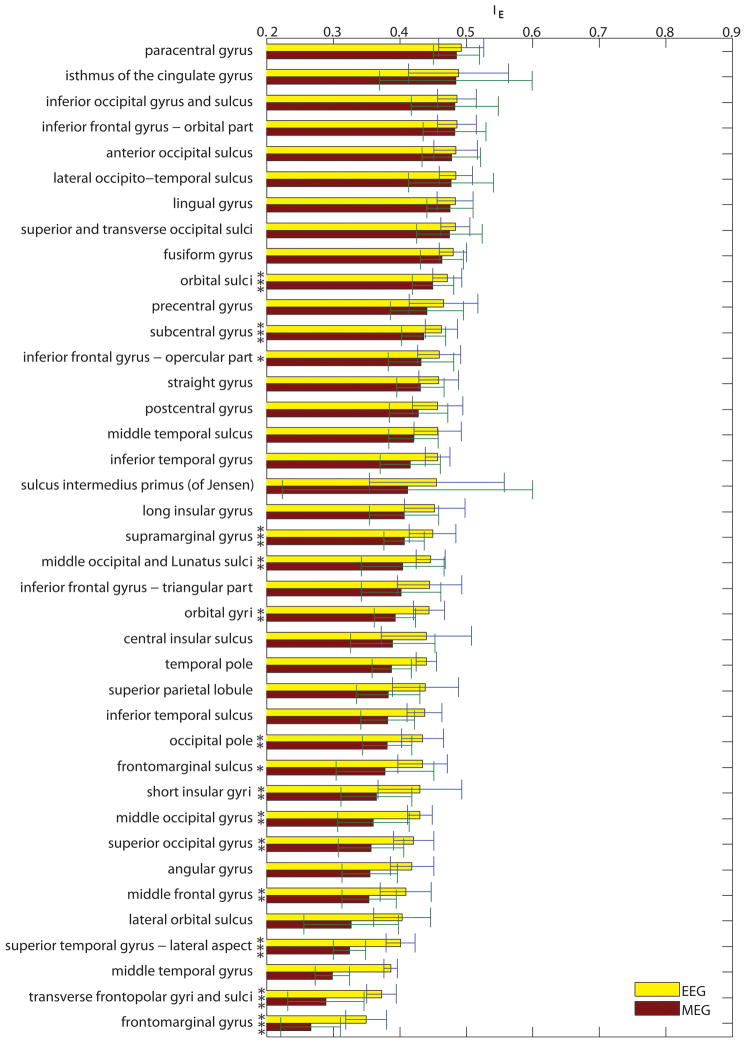
Figure 4.
(A) Bar plots of the average enhancement index for each cortical parcellation, ordered in decreasing order from the highest to the lowest enhancement index for MEG. Values for both EEG (yellow) and MEG (red) are shown. Error bars indicate standard deviations over subjects. Standard deviations for MEG are consistently higher than for EEG, presumably due to the larger dependence of enhancement upon source orientation. Significance of differences between means is indicated by asterisks next to each parcellation, where one, two and three asterisks correspond, respectively, to alpha values of 0.1, 0.01, and 0.001. (B) As in (A), continued.


