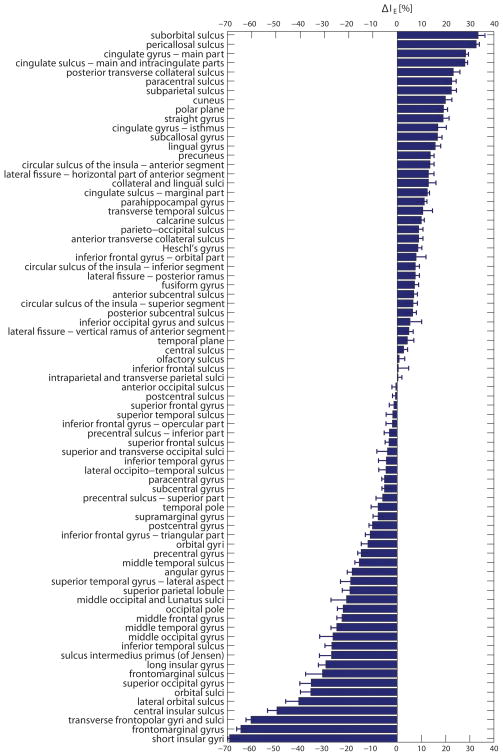
Figure 5.
Difference in enhancement index between MEG and EEG plotted as a percentage of the MEG enhancement index, using Equation 6. Error bars indicate standard errors of the mean. For each parcellation, a positive value indicates that MEG is relatively more sensitive than EEG to signals generated by patches of cortical activation in that region. A negative value indicates that EEG is relatively more sensitive than MEG in this region.

