
Figure 1.
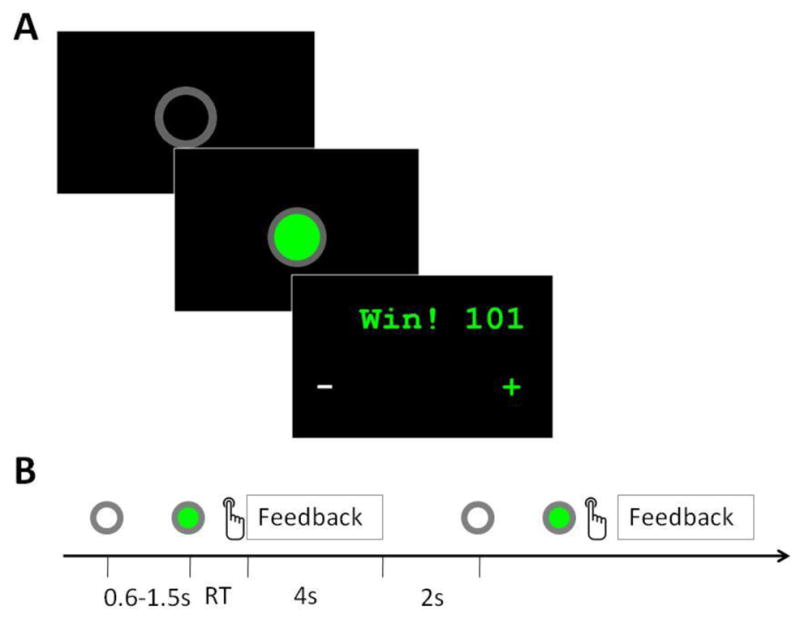
Task flow of the cooperation experiment. (A) Screenshots of the ready signal, “go” signal, and feedback window in a single trial. (B) Time flow of the experiment, showing two consecutive trials. The entire cooperation task consisted of two task blocks separated by a 30s rest period. Each task block consisted of 20 trials. RT: Response time.