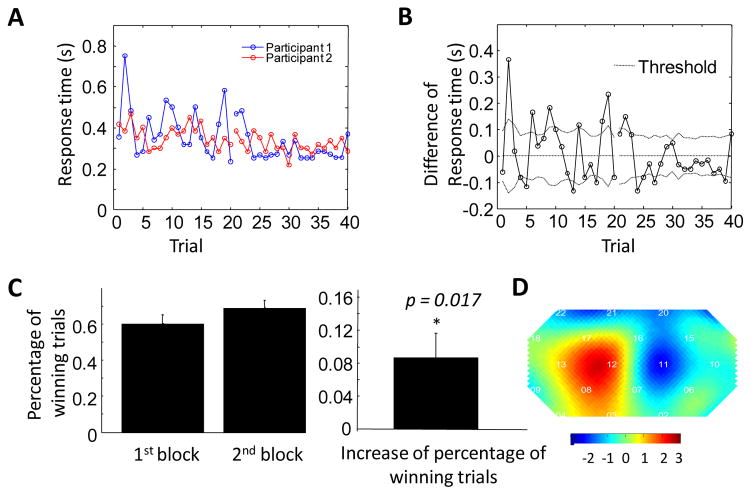
Figure 5.
The inter-brain coherence is higher during the 2nd task block in the cooperation experiment. (A) Response times of the two participants in a representative pair as a function of trial number. It can be seen that the response time is closer in the 2nd block. (B) The difference between response times as a function of trial number. (C) The percentage of winning trials in the first and second cooperation block (left), and the increase in percentage of winning trials between the first and second cooperation task blocks, averaged across all participants. The percentage of winning trials in the second block is significantly higher than that in the first block, demonstrating a learning process. (D) t-test map of coherence change (coherence in the 2nd block minus that in the 1st block) shows that coherence in right frontal cortex is significantly higher in the second cooperation task block (p<0.02).

