
Figure 3.
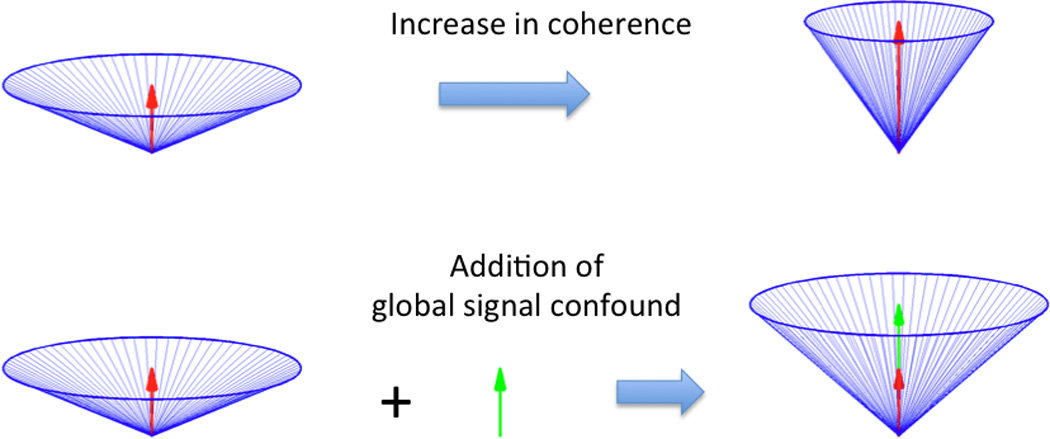
Simplified geometric model of resting-state data and the global signal. In the top row, an increase in the coherence of the resting-state vectors (blue lines) leads to both an increase in the magnitude of the global mean signal (red arrows) and a decrease in the angle between the vectors and the global signal. In the bottom row, the addition of a global signal confound (green arrow) leads to both an increase in the magnitude of the global mean signal and a decrease in the angle between the vectors and the global signal. Note, however, that in the top row the length of the resting-state vectors remains constant, while in the bottom row the additive signal confound causes the vectors to increase in length. As the additive confound grows in magnitude, the vectors become more correlated, obscuring the true underlying correlation.