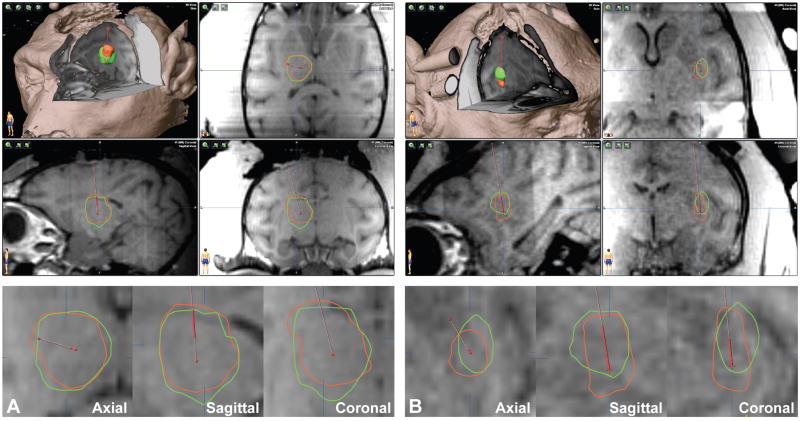
Figure 5. Screenshots of the simulation software.
(A) Thalamus infusion of 298 μL with 80% coverage and 17% leakage. (B) Putamen infusion of 51 μL with 56% coverage and 43% leakage. (Top) 3D-cutaway and 3-plane views with an overlay of the simulated (green) and gadolinium (red) distribution volumes. (Bottom) Higher magnification views of the overlay.

