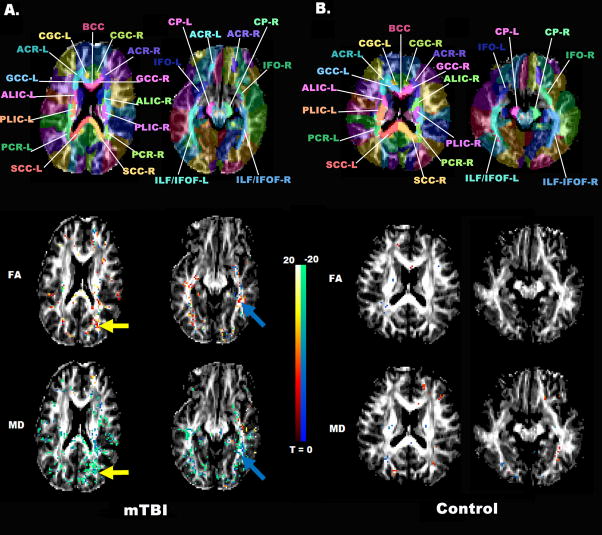
Figure 2.
T-statistic Map from the WB-Permutation Test
Permutation T-statistic maps of FA (middle row) and MD (bottom row) in the mild TBI athlete (A) and control subject 5 (B) are superimposed on the FA map. Red voxels represent a significant pre-season to post-season/injury increase, while green voxels represent a decrease. The transformed JHU WMPM is also superimposed on the FA map of the corresponding individuals (top row). Deep white matter structures are clearly labeled for identification of regions with significant FA/MD changes from pre- to post-season.

