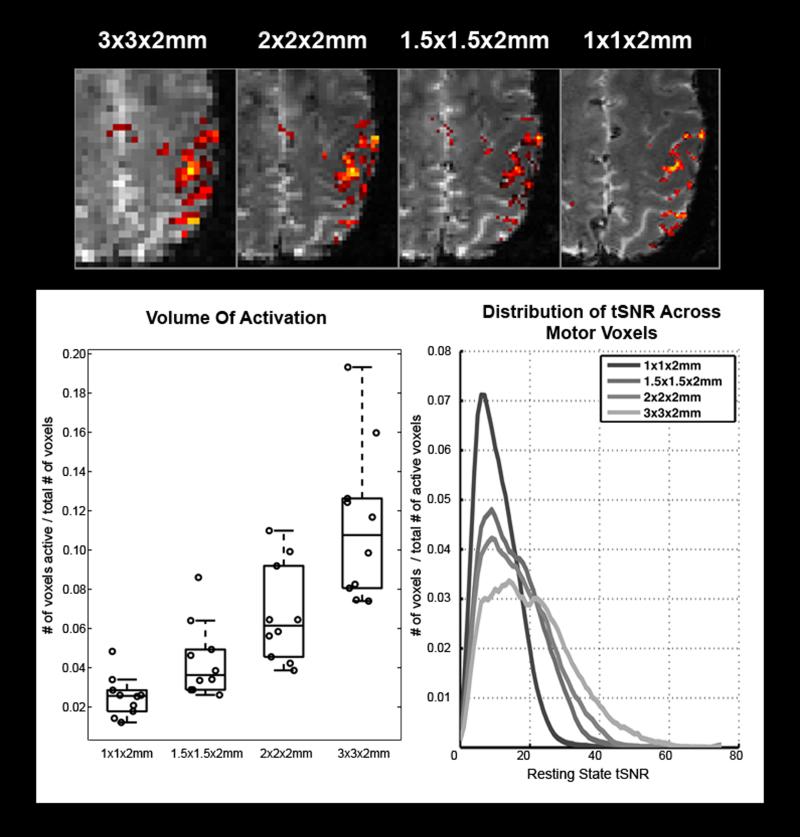
Figure 5.
(top) An example of activation changes as a function of spatial resolution. Note that activity becomes more focal as voxel volume decreases. (bottom left) A plot of the estimated activated volume measured at each available spatial resolution. Circles represent individual measurements made in each subject. Box lines are at the lower quartile, median, and upper quartile of the data. Whiskers extend from each end of the box to the adjacent values in the data. (bottom right) The average distribution of resting state tSNR measured among motor voxels, averaged across subjects. Note the expected increase in tSNR as voxel volume increases. Voxel counts were normalized by the total number of voxels in the image to adjust for the changing total number of active voxels from one resolution to another.

