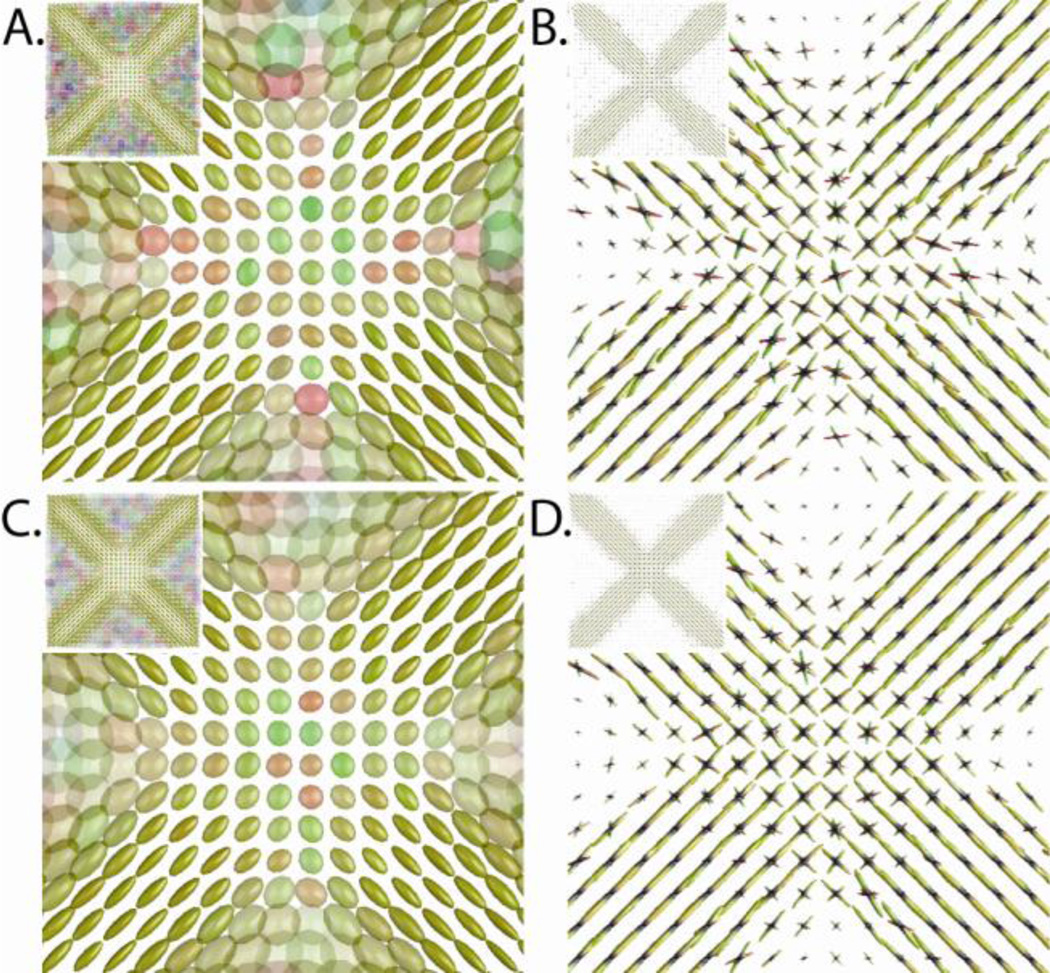
Figure 3.
Simulation of crossing fibers at an SNR of 15:1 (A&B) and 25:1 (C&D). Tensor fits to a DTI acquisition of a fiber crossing region (left: A&C) results in a zone of planar tensors (enlarged for detail) where directional orientation is ambiguous. CFARI estimate (right: B&D) are able to identify the underlying structure using the same simulated dataset. For each voxel, the five CFARI directions with the highest partial fraction are shown weighted by partial fraction. Tensors (A&C) are colored by principle eigenvector (red=horizontal, green=vertical, blue=out of plane) and rendered with shading. Fiber orientation plots (B&D) show a surface mesh where each point is colored by the normalized coordinate (red/green/blue as with tensors; zero is at the origin of each glyph), and the distance from the origin is proportional to the estimated partial fraction.

