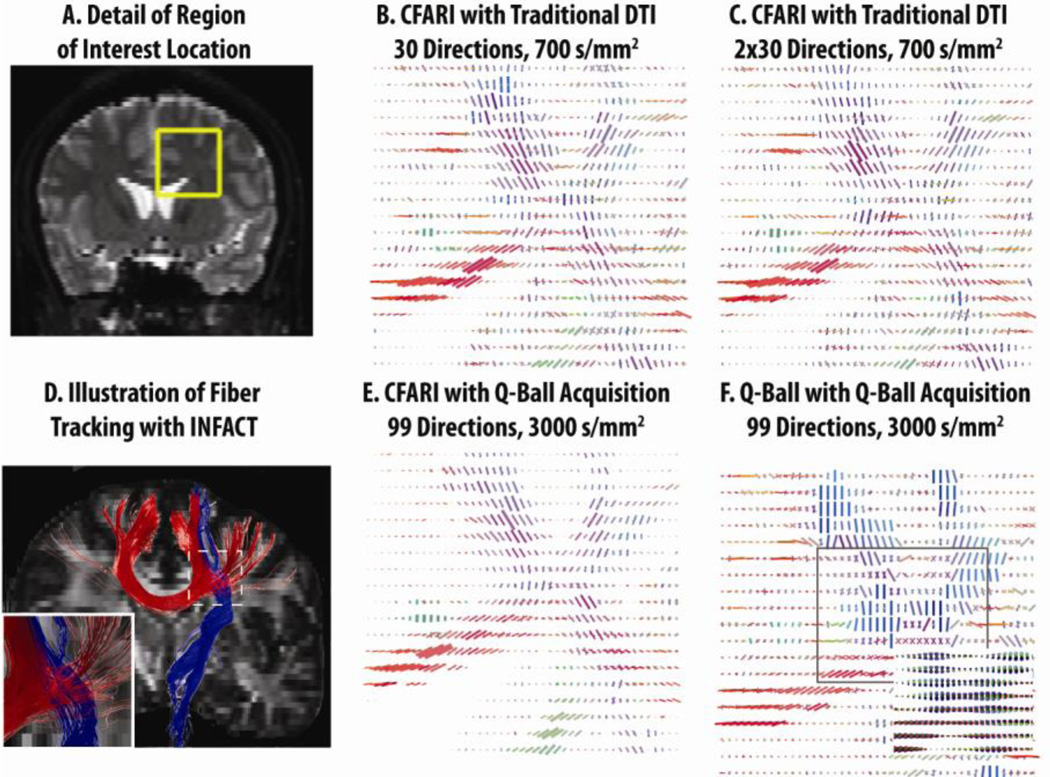
Figure 9.
Qualitative inspection of intra-voxel orientations estimated with in vivo data show patterns consistent with anatomy, which can be clearly appreciated in the region of the corpus callosum and internal capsule (highlighted in A). CFARI directions are visually consistent even with what one would expect from anatomical consideration while analytic q-ball (F) show shows consistency using higher b-value data. Note that the maximal directions for q-ball were extracted from the parameterized orientation distributions function (inlay of F). Fiber tracking with the data in (D) show results that are visually consistent with the crossing of major fiber tracts.

