Figure 10.
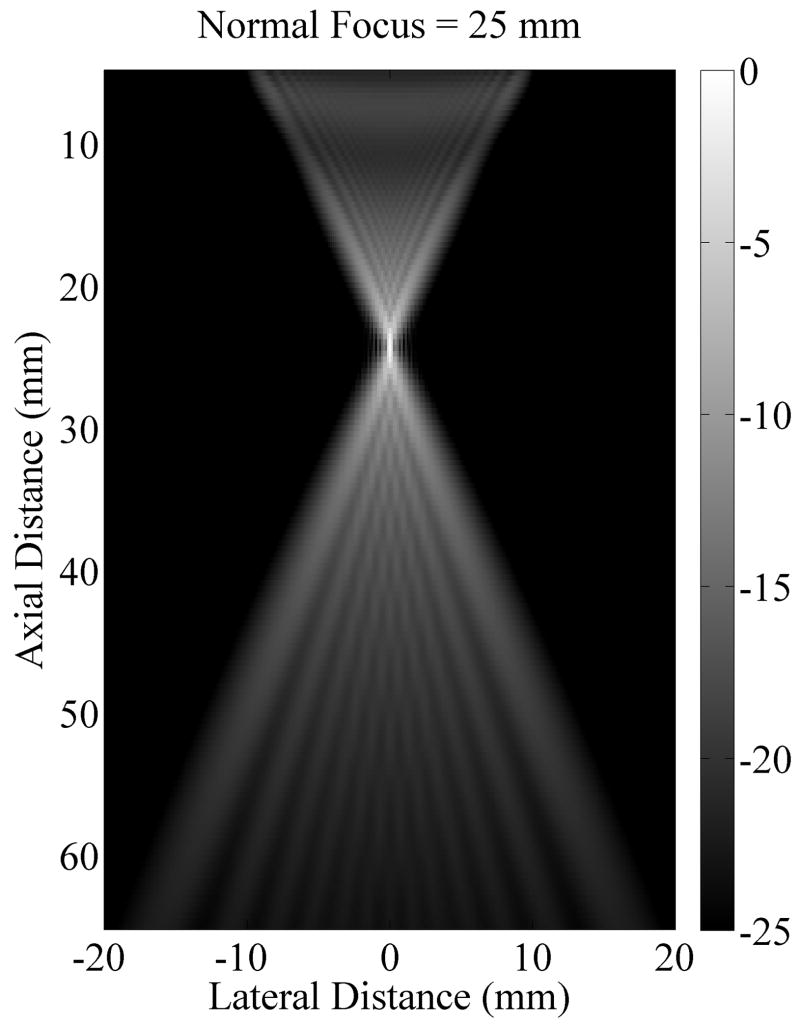
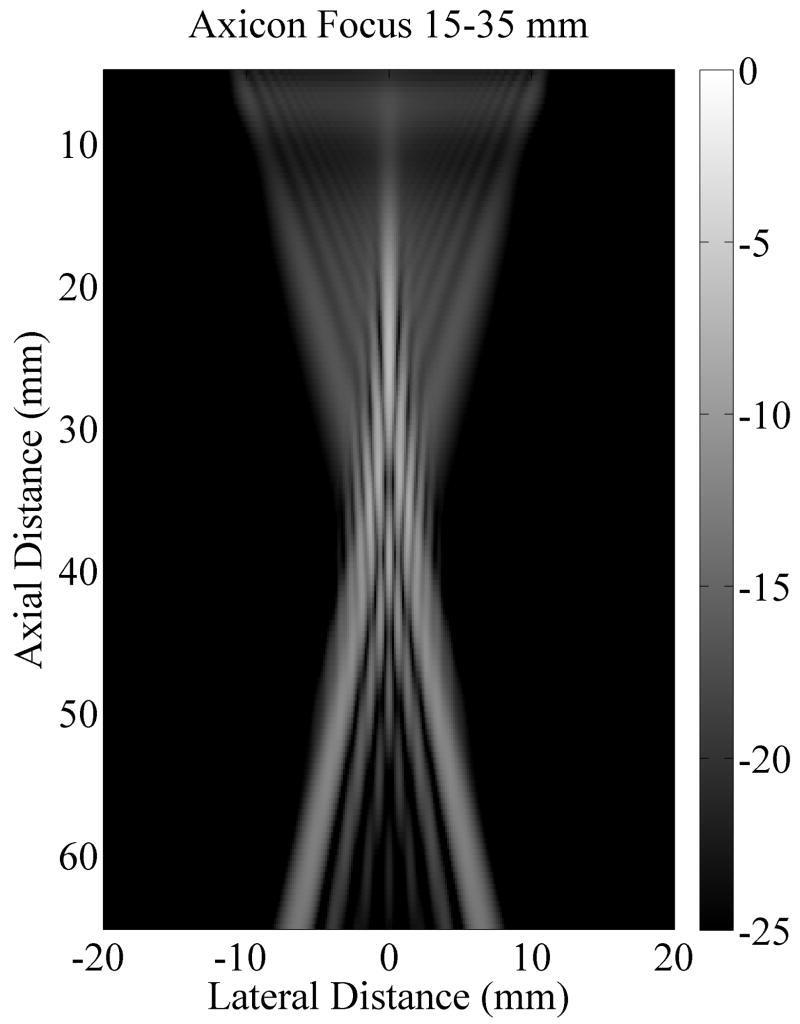
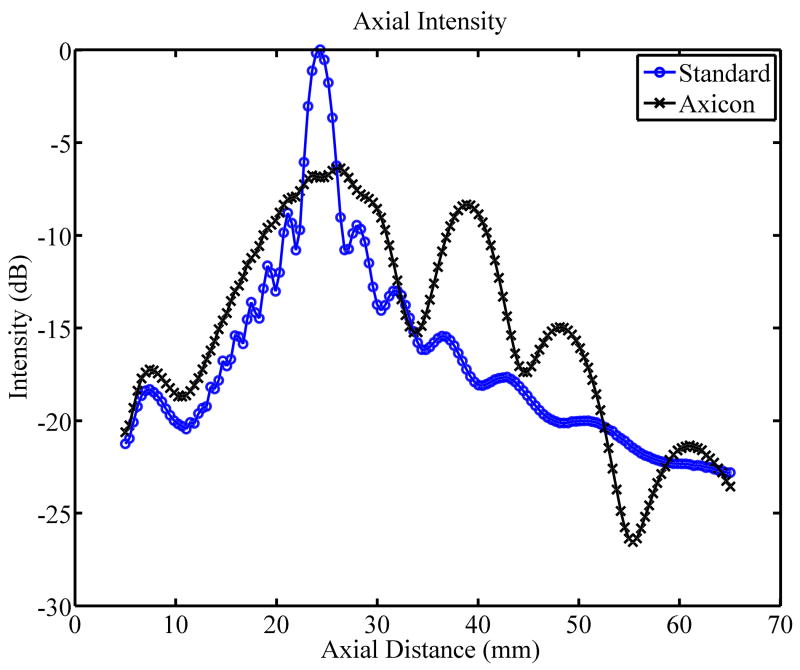
Comparison of the radiation patterns for the axicon and standard focusing. (a) Simulated radiation pattern for a standard focus beamforming scheme with the focus at 25 mm. (b) Simulated radiation pattern for an axicon focus beamforming scheme with the near focus at 15 mm and the far focus at 35 mm. Gray scale indicates intensity in dB for (a) and (b). (c) Axial profiles for standard and axicon focusing.


