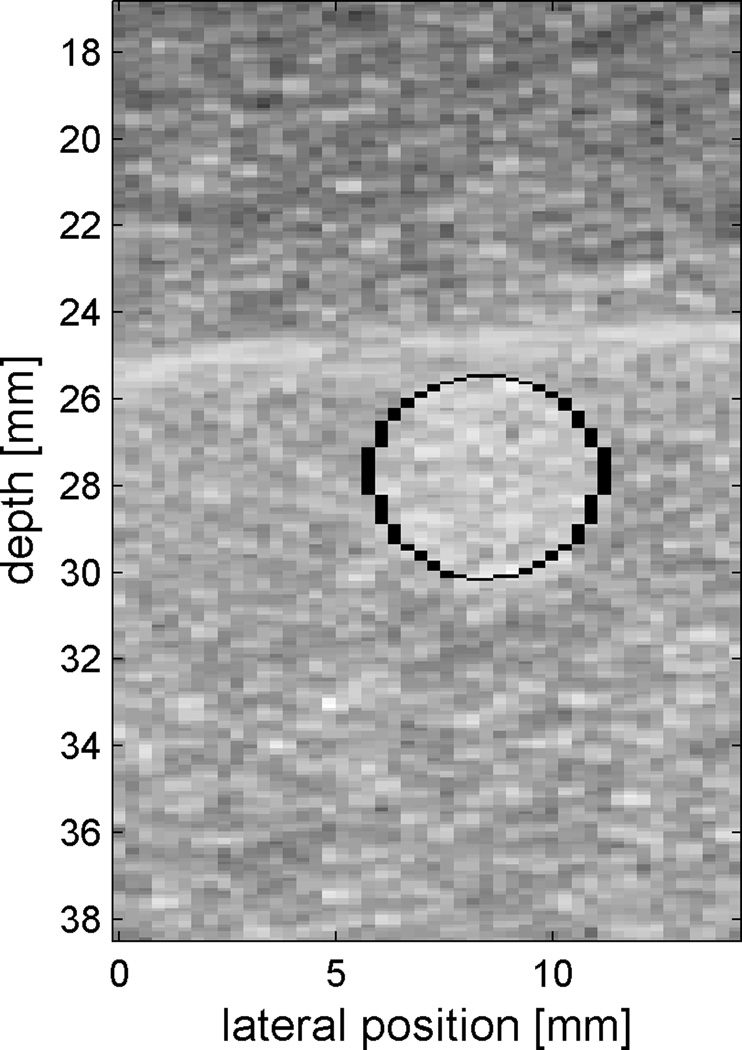
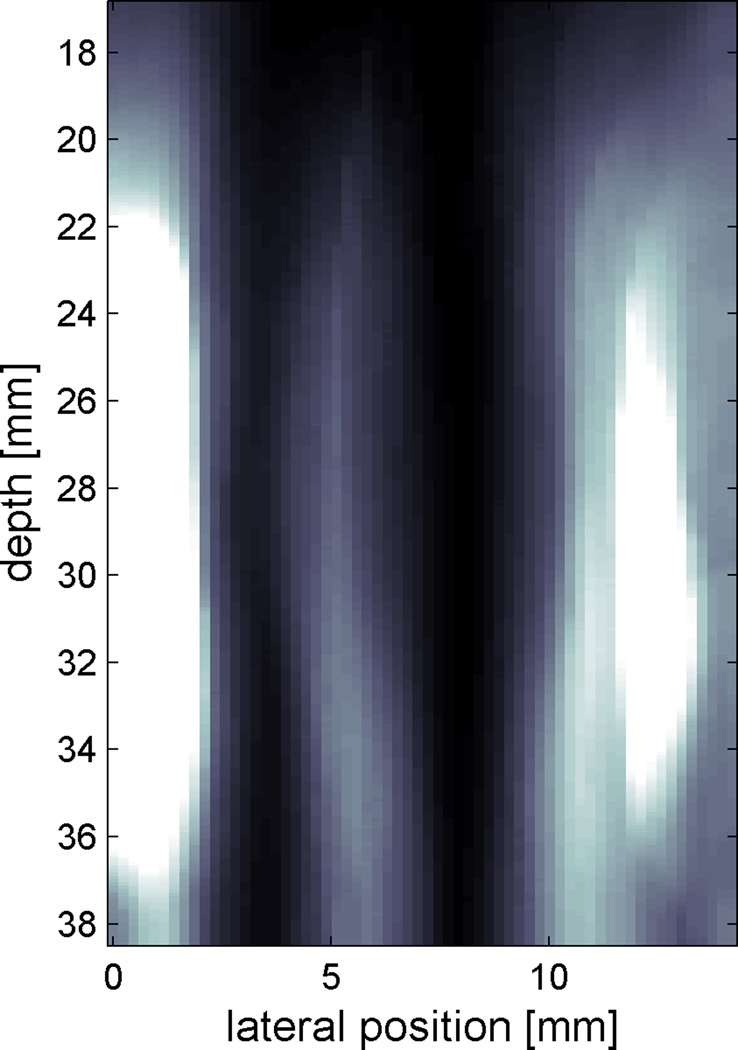
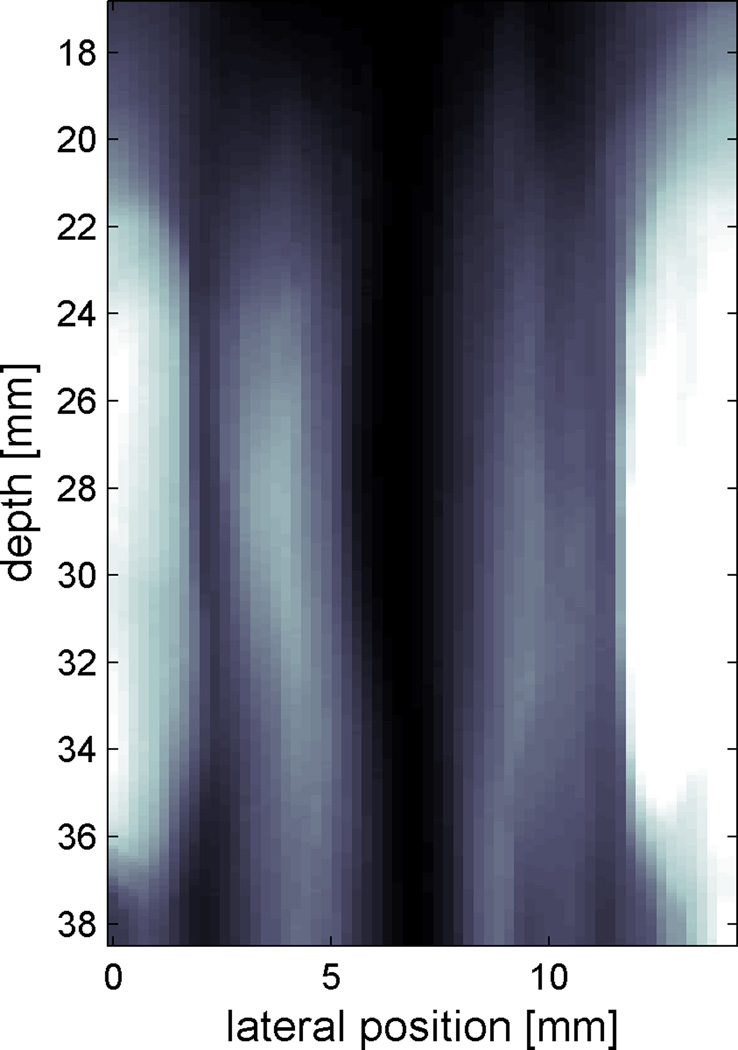
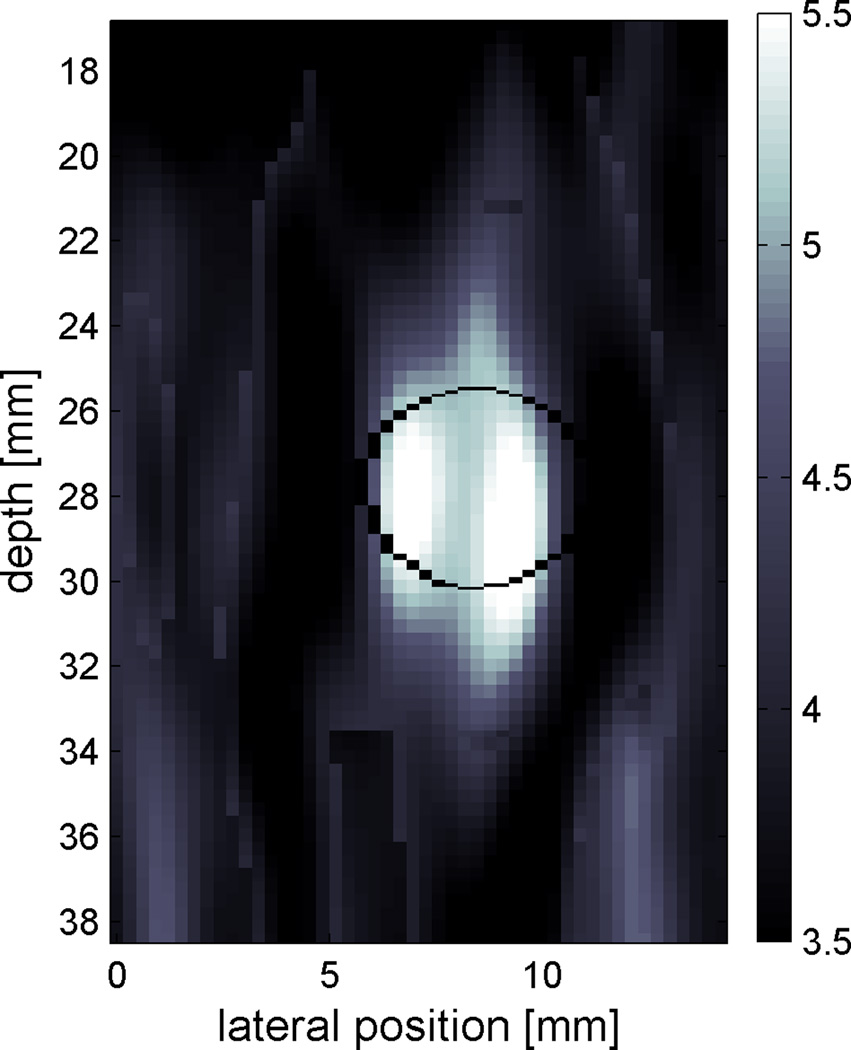
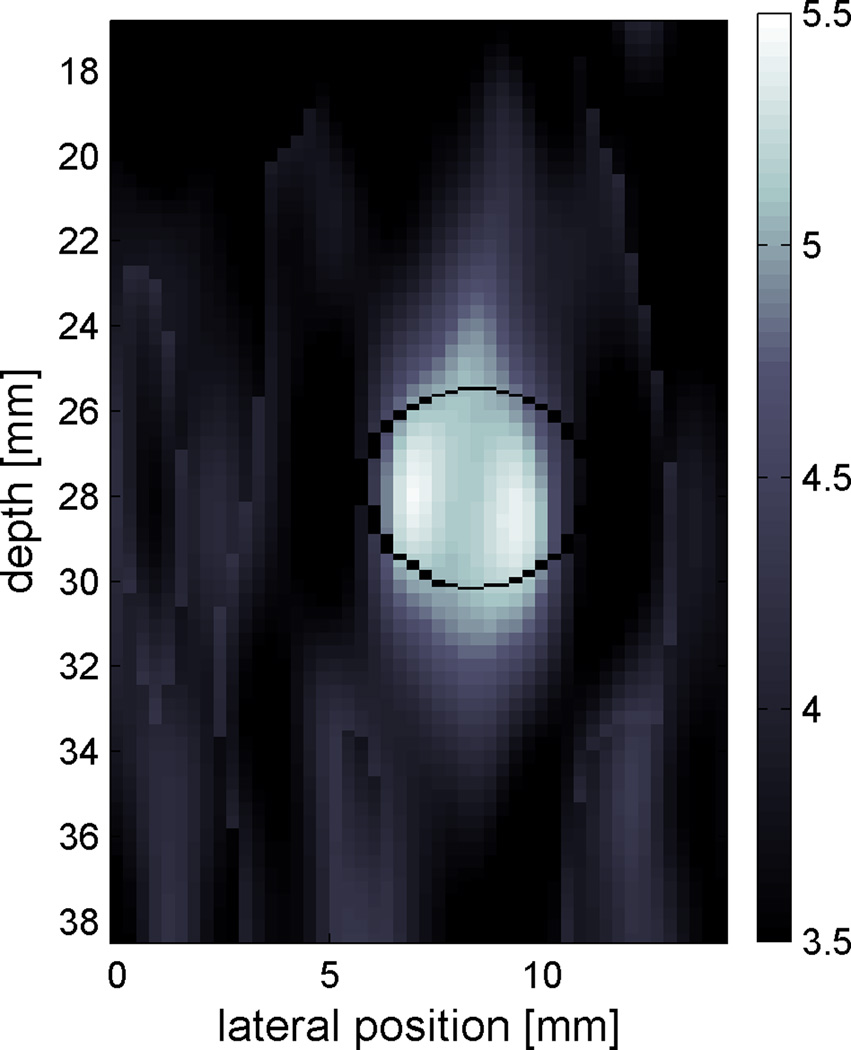
Figure 7.
A B-mode image of the phantom with a 6mm inclusion is shown in (a) with an outline of the inclusion. Two frames of the CrW movie synthesized at 250Hz and 300Hz are shown in (b) and (c) respectively. Gray scale is relative variance of displacement over time. The estimated shear speed images are shown in (d) and (e) for the frequency of synthesis at 250Hz (d), and 300Hz (e), respectively.

