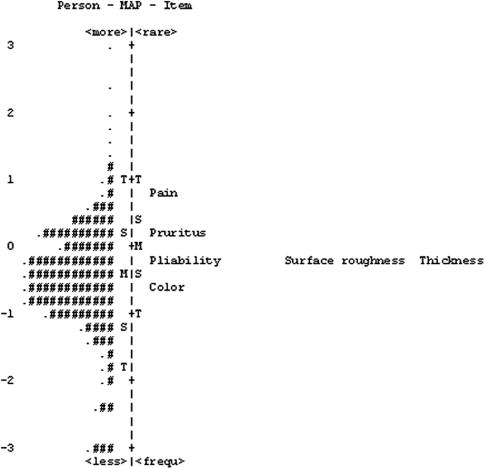
Fig. 2.
Person (n = 1,427) and item (6 items) or Wright map for the Patient Scale. Positive scores indicate poorer scar quality, whereas negative scores demonstrate better scar quality. Items from the scale are shown on the right-hand side of the figure, and person measures are highlighted by a ‘#’ or ‘.’ Each ‘#’ represents 13 subjects, and each ‘.’ represents 1–12. M mean, S 1 SD from the mean, T 2 SD from the mean

