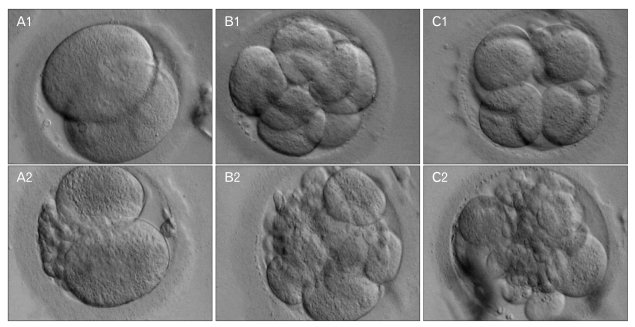
Fig. 1.
The morphology of embryos at different time points post-intracytoplasmic sperm injection (ICSI) (×400). (A1) An embryo 48 h post-ICSI. (A2). An embryo 48 h post-ICSI, although the quality was lower compared to A1. (B1) An embryo 72 h post-ICSI. (B2) An embryo 72 h post-ICSI, although the quality was lower compared to B1. (C1) An embryo 72 h post-ICSI at morula stage. (C2) An embryo 72 h post-ICSI at morula stage, although the quality was lower compared to C1.

