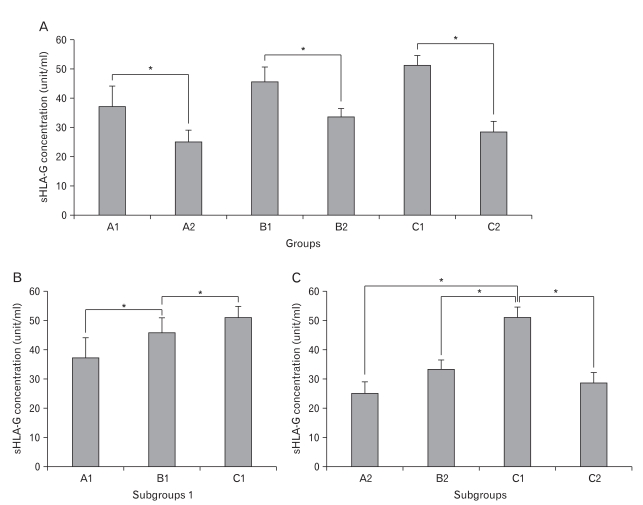
Fig. 2.
The concentration of sHLA-G in each group measured by enzyme-linked immunosorbent assay. (A) The concentration in all groups/subgroups. (B) Comparison of the concentration between each subgroup 1. Note that the concentration increased in each group compared to the previous group. (C) Comparison of the concentration between each subgroup 2. Addition of C1 in this figure was to show there was no statistically significant change between subgroups 2. Each data point represents three independent measurements and the error bars indicate the standard error of the mean. sHLA-G, soluble human leukocyte antigen, class I, G. *P<0.05 were referred to as statistically significant differences.

