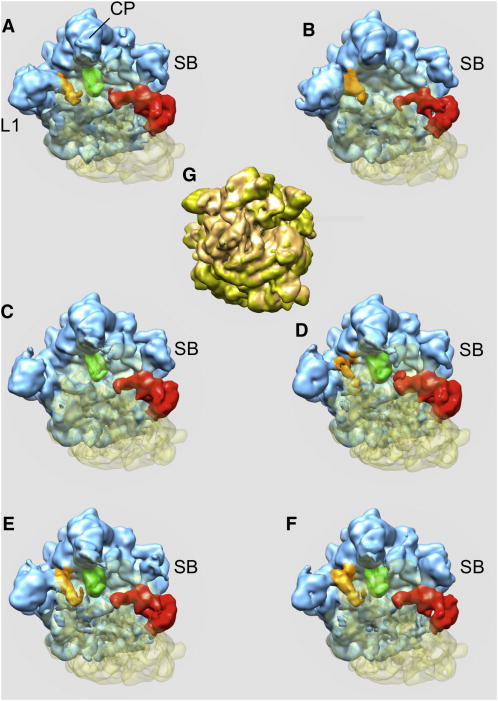
Figure 3.
Six structures derived from the data set of 586,329 cryo-EM projection images of the Thermus Thermophilus 70S•tRNA•EF-Tu•GDP•kirromycin complex obtained with K-means clustering using factorial coordinates derived from the first three dominating eigenvolumes and 3D reconstruction according to 2D projection assignments to clusters (a-f). Structures (a,c-f) of the ribosome are in classical conformation, while sub-population (b) is in the rotated conformation (RTS). (g) - RTS between structure (b) shown in light brown and structure (c) shown in gold. CP, central protuberance; SB, stalk base; L1, protein L1. Blue – 50S subunit, transparent yellow – 30S subunit, brown – E-site tRNA, green – P-site tRNA, red – EFG. See also Figures S2-S7 and Tables S1 and S2.

