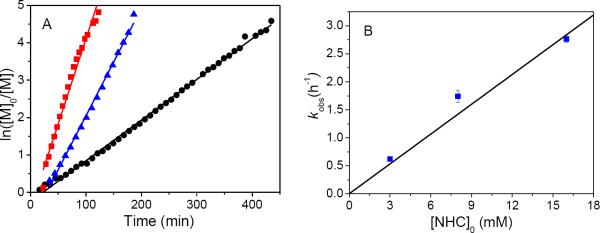
Figure 5.
(A) Plots of ln([M1]0/[M1]) versus the reaction time and their linearly fitted curves for the NHC-mediated polymerizations of M2 at 70 °C in toluene-d8 at three different initial NHC concentration (i.e., [NHC]0 = 3 (●), 8(▲), 16 mM (■)) and a constant initial monomer to NHC concentration (i.e., [M1]0:[NHC]0 = 50:1). (B) Plot of the observed rate constant (kobs) versus the initial NHC concentration and the linearly fitted curves.

