
Figure 2. Gel retardation assay of enzyme/polyion complexes.
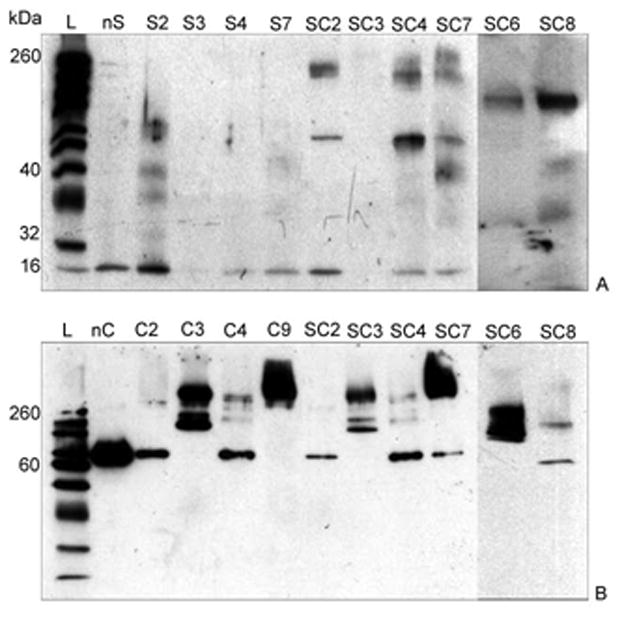
Five μg protein was loaded on a 10% polyacrylamide gel and electrophoresis was carried out as described earlier. Bands were visualized with A) anti-SOD1 and B) anti-catalase polyclonal antibodies. L refers to ladder. nS and nC refer to native SOD1 and catalase, respectively. The lanes correspond to the following samples of cross-linked nanozymes listed in Table 1: S2, S3 and S4 – SOD1/PEI-PEG (Z=1) cross-linked using GA, BS3 and EDC/S-NHS respectively; S7 – SOD1/pLL10-PEG (Z=10) cross-linked using EDC/S-NHS; C2, C3 and C4 - catalase/PEI-PEG (Z=1) cross-linked using GA, BS3 and EDC/S-NHS, respectively; SC2, SC3, SC4 – SOD1-catalase/PEI-PEG (Z=1) cross-linked using GA, BS3 and EDC/S-NHS, respectively; SC6, SC7, SC8 (all prepared at Z=1) indicate SOD1-catalase/pLL10-PEG (BS3), SOD1-catalase/pLL10-PEG (EDC/S-NHS) and SOD1-catalase/pLL50-PEG (EDC/S-NHS) respectively.