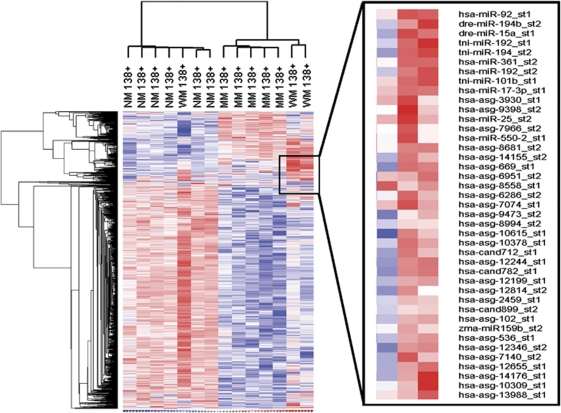
Figure 3.
miRNA expression profiling in CD138+ plasma cells derived from WM, MM and NM donors. Heatmaps were generated using unsupervised hierarchical clustering of all miRs detected in at least one sample. Only known human miRNAs from the Sanger miRBase have been included for analysis. Generalized log ratios (glog2) for each miRNA are represented. Gradations of blue and red mean lower and higher expression levels, respectively.

