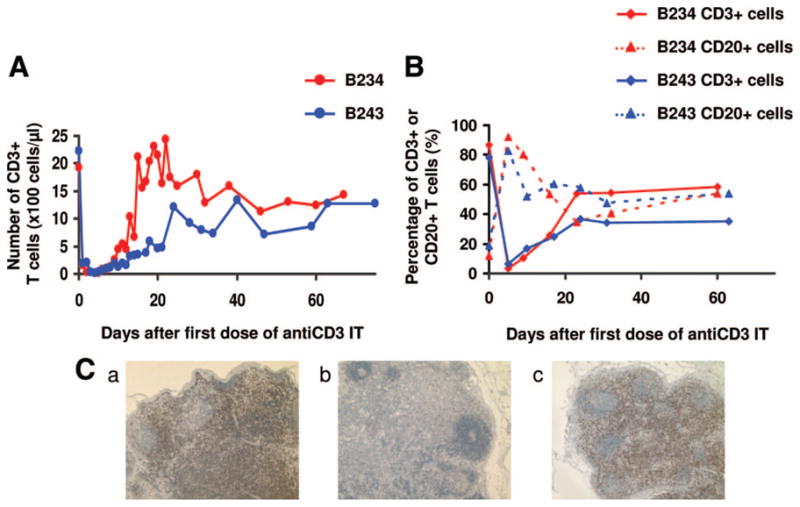
FIGURE 1.

(A) Absolute number of CD3+ cells in peripheral blood after administrating of 25 μg/kg ×8 anti CD3-IT. (B) Percentage of CD3 or CD20+ cells in lymph node (LN) after administrating of 25 μg/kg ×8 anti CD3-IT. (C) Histology of lymph node after administrating of 25 μg/kg ×8 anti CD3-IT (hematoxylin-eosin staining). Pretreatment state (a), in contrast with the pretreatment state, the T-cell areas of LN decreased on day 5 (b) but recovered by day 60 (c).
