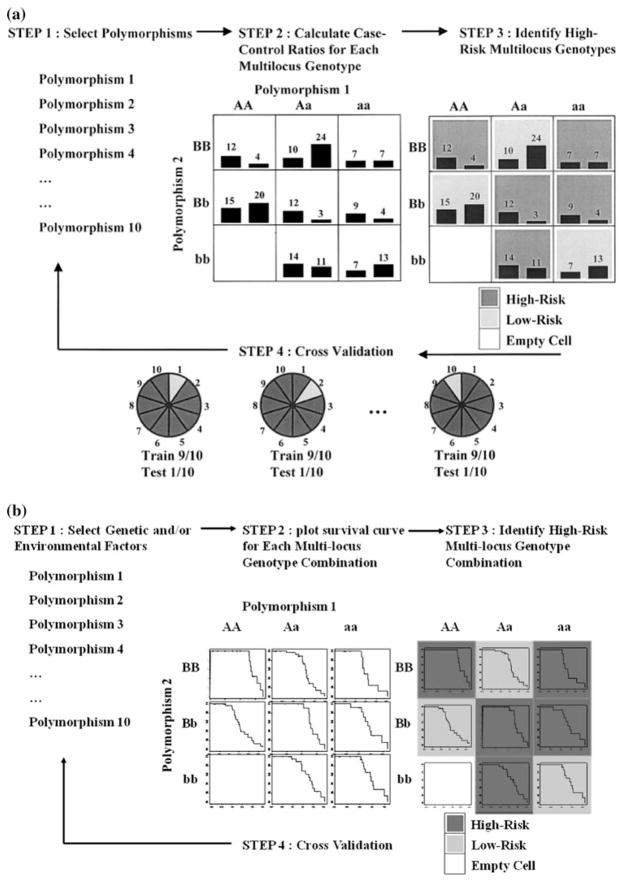
Fig. 1.
a MDR attribute construction. Here, we use a threshold T = 1 to determine the high and low risk groups. A new binary attribute is created with those two levels. b Surv-MDR attribution construction. Survival curve in each genotype combination is compared to other genotype combinations to determine the high and low risk groups

