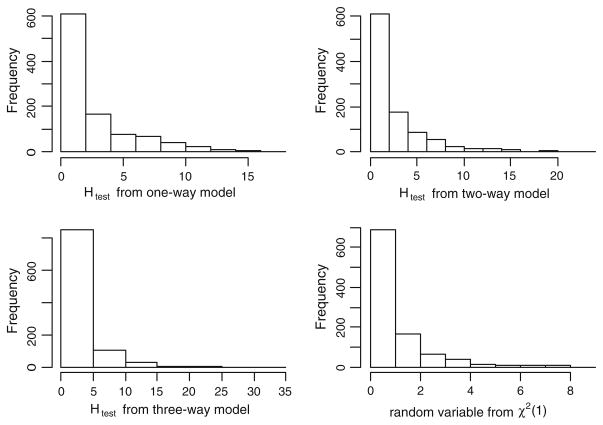
Fig. 2.
Histograms of the log-rank test statistics from cross-validation. The upper left plot is the statistics from one-way model. The upper right plot is the statistics from two-way model. The lower left plot is the statistics from three-way model. The lower right plot is the random variables from χ2(1)

