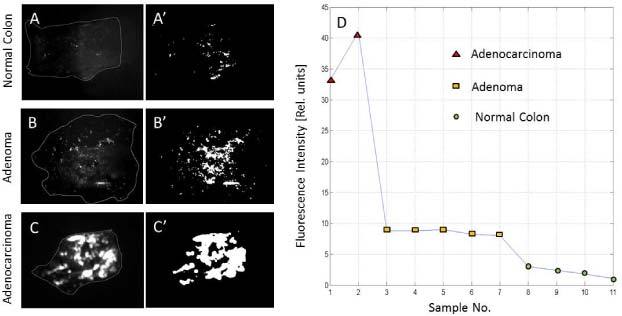
Fig. 12.

(A, B, C) Representative fluorescence images for normal colon, colon adenoma, and colon adenocarcinoma. (A′, B′, C′) Processed images with removed background noise. (D) Integrated fluorescence signal for 11 specimens that were assigned to the three pathologies.
