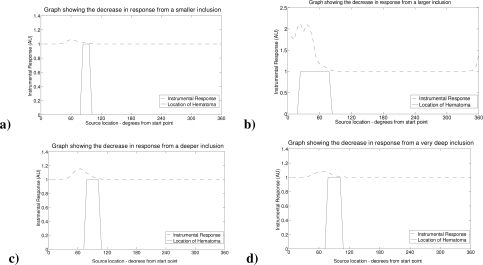
Fig. 7.
A set of graphs illustrating how the model can be used to identify the device’s ability to discriminate and detect hematomas based on size: a) smaller—50% size; b) larger—two radially aligned touching spheres of the same size, and on depth: c) at an extra 5 mm depth; d) at a further 5 mm depth.

