Figure 7.
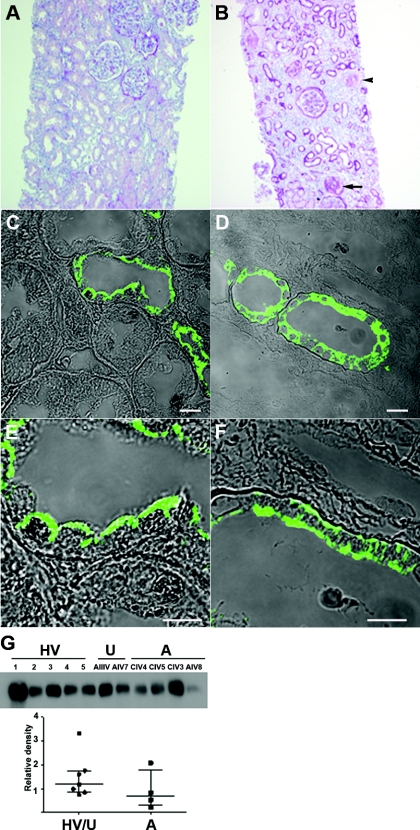
Renal histology and urine biochemistry. (A) Normal renal cortical histology. (B) Renal biopsy of patient CIV.4, demonstrating parenchymal tubular atrophy and interstitial fibrosis, with associated glomerulosclerosis (arrow). Small arteries show prominent myointimal thickening (arrowhead). (C through F) Uromodulin expression is abnormal in the patient (D and F) compared with normal kidney (C and E). Bar, 10 μm. (G) Western blot of urine from healthy volunteers (HV: 1 to 5), unaffected relatives (U: AIII.V and AIV.7), and affected individuals with preserved renal function (A: CIV.4, CIV.5, CIV.3, and AIV.8). The amounts of uromodulin were quantified by densitometry, protein loading having been corrected for urinary creatinine.

