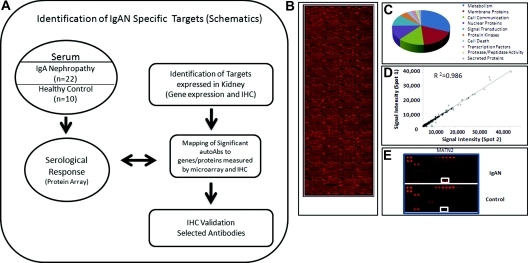
Figure 1.
(A) Study flow diagram used to identify IgA nephropathy (IgAN)-specific autoantibodies (autoAbs) by immune response biomarker profiling, bioinformatics to map targets of significant autoAbs with genes and proteins expressed in kidney by microarray and immunohistochemistry (IHC), and IHC validation. (B) A representative protein array from an IgAN patient in this study, probing approximately 8200 proteins. (C) The biologic functional classes of the proteins on the protoarray probed. (D) Quality control results from duplicate spots printed on the protoarray demonstrating very stringent correlation (R2 = 0.986). (E) A representative close-up of the protoarray showing visible Alexa fluorophore signal intensity differences in IgAN and healthy controls.

