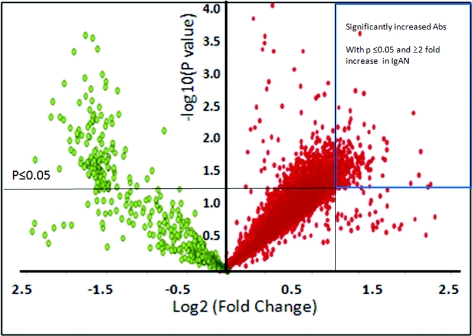
Figure 2.
Increased immune response in IgA nephropathy (IgAN). The volcano plot demonstrates immune response in terms of autoantibodies (autoAbs) in IgAN when compared with normal controls. Each red spot on the plot represents an increased autoAb compared with the control, and each green spot represents a decreased autoAb against control. One hundred seventeen autoAbs with significant increase (with P ≤ 0.05 and ≥2-fold increase in IgAN) are boxed (upper right corner).

