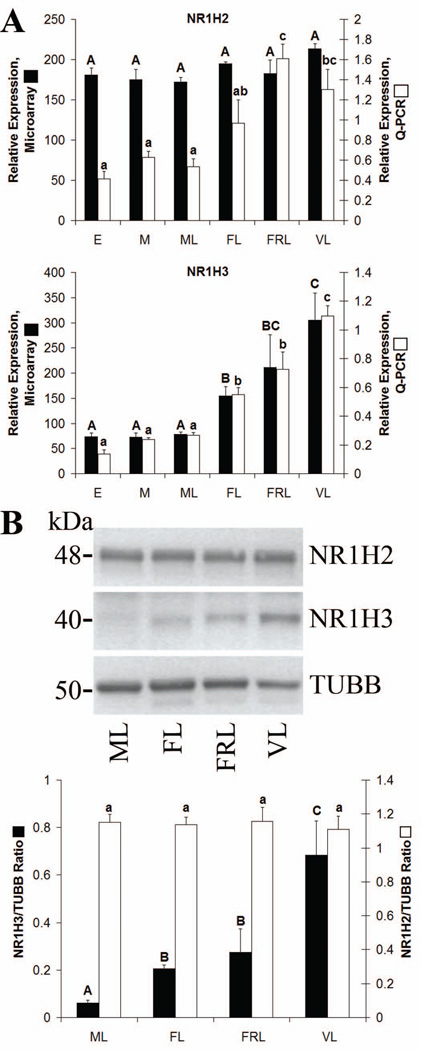
Figure 5. NR1H2 and NR1H3 expression in the rhesus macaque CL.
Panel A contains microarray and Q-PCR expression data for NR1H2 and NR1H3 during the early (E), mid (M), mid-late (ML), functional late (FL), functionally-regressed late (FRL), and very-late (VL) stages of the luteal phase. Panel B contains Western blot data for NR1H2 and NR1H3. Images are from pooled CL collected at the ML, FL, FRL, or VL stages. The graph presents densitometry results from analysis of individual CL (n = 4 CL/group). Error bars indicate one SEM. Columns with different letters of the same case are significantly different (p< 0.05).

