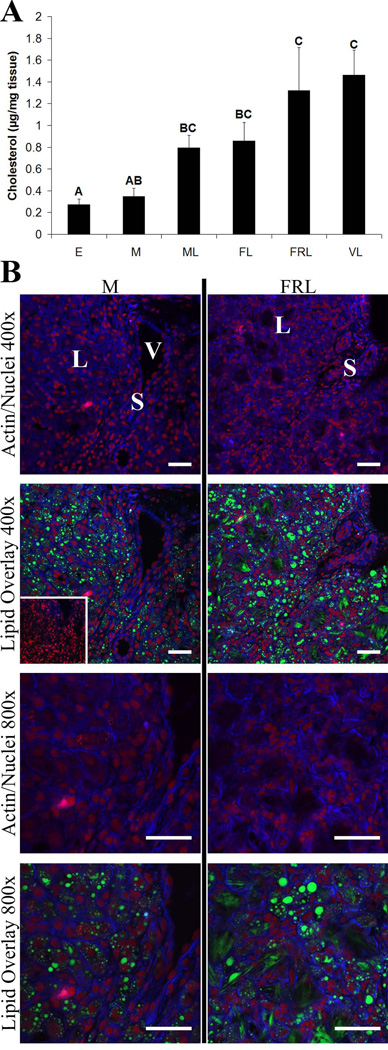
Figure 8. Rhesus macaque luteal cholesterol levels and cholesterol ester/lipid droplet localization prior to and following spontaneous functional regression.
Panel A contains normalized cholesterol concentrations in CL extracts from the early (E), mid (M), mid-late (ML), functional late (FL), functionally-regressed late (FRL), and very-late (VL) stages of the luteal phase. Error bars indicate one SEM. Columns with different letters of the same case are significantly different (p< 0.05). Representative lipid droplet staining and localization results, as determined by confocal microscopy, are presented in panel B for the mid and functionally-regressed late stages. Actin is represented by blue fluorescence, nuclei are red, and neutral lipids including cholesterol esters are green. The inset in the mid 400× lipid overlay is a parallel section that was extracted with methanol to remove all lipids (background control). The approximate locations of various cell types are indicated in the first image for each stage and include: large luteal cells (L); small luteal or stromal cells (S); and blood vessels (V). The scale bar in the lower right hand corner of each image is 50 µm.

