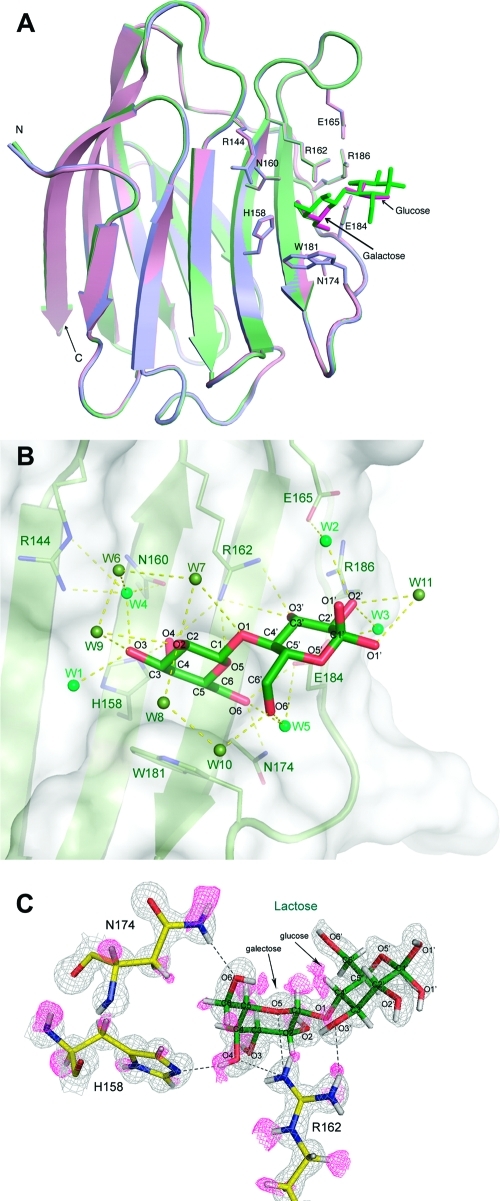
Figure 1.
Atomic-resolution structures of Gal3C, in the presence of lactose (green) or glycerol (pink) and in the apo form (blue). (A) Gal3C displays an identical conformation in all complexes, and the binding sites are highly comparable. Lactose and glycerol molecules are shown as green and pink sticks, respectively. Key side chains coordinating the ligands are indicated. (B) The carbohydrate-binding site of the lactose–Gal3C complex at 0.86 Å resolution reveals water molecules W1–W5 (dark green spheres) that mediate hydrogen bonding between lactose and Gal3C. Additional water molecules that coordinate lactose, but not the protein, are shown as light green spheres. Hydrogen bonds are represented as dotted lines. (C) Electron density in the lactose-binding site, identifying important hydrogen atoms. The 2Fo – Fc electron density map contoured at 1.5σ (gray mesh) and the Fo – Fc map contoured at 2.0σ (pink) were obtained after removal of H atoms followed by 10 refinement cycles to remove bias. The Fo – Fc map was also contoured at a lower level of 1.6σ to visualize the H density around C6 and O6 of lactose.

