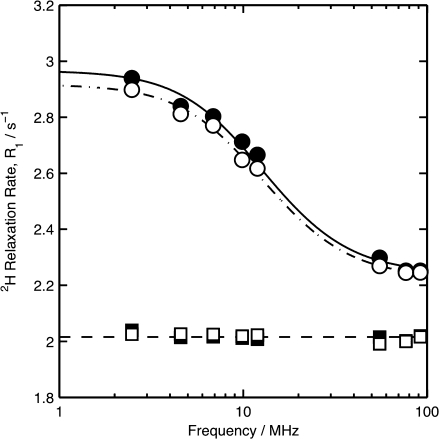
Figure 4.
Nuclear magnetic relaxation dispersion of apo-Gal3C (○) and lactose-bound Gal3C (●). Empty and filled squares represent the corresponding data from the reference samples without Gal3C. The relaxation rates for the lactose samples are downshifted by a small (0.05 s–1) and frequency-independent difference between the reference samples to facilitate comparison. The errors are of the same size as the symbols.

