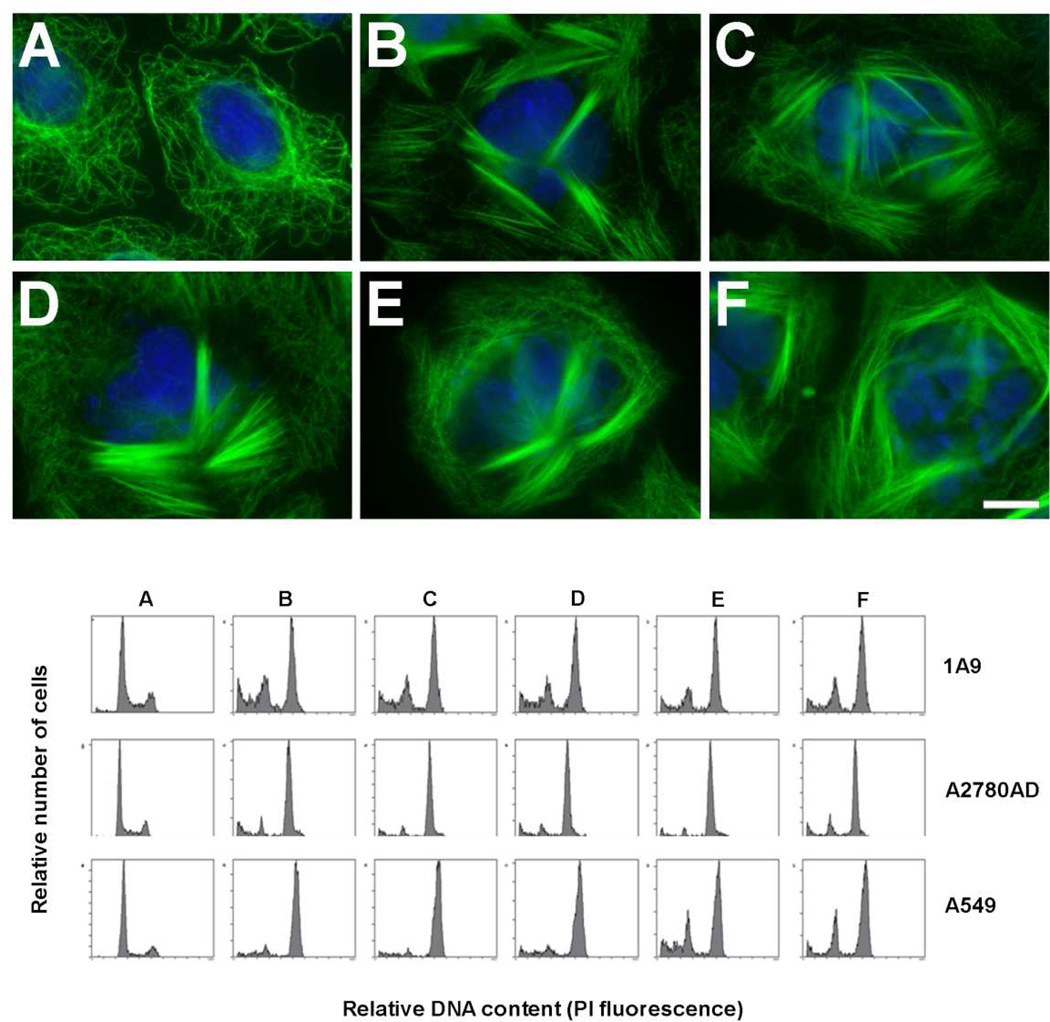
Figure 2.
Upper Panel. Effect of Cs and derivatives on the cytoplasmic MTs of A549 cells. Cells were incubated either with drug solvent (DMSO) (control cells) (A), 500 nM Cs (B), 2.5 µM 8Ac-Cs (C), 2.5 µM [14C]8Ac-Cs (D), 5 µM 6CA-Cs (E) or 5 µM 8CA-Cs (F). MTs were immunostained with an α-tubulin monoclonal antibody, and DNA was stained with Hoechst 33342. Insets are mitotic cells from the same preparation. The scale bar represents 10 µm. Lower Panel. Effect of Cs and derivatives on the cell cycle of 1A9, A2780AD and A549 cells. Cells were incubated either with drug solvent (DMSO) (control cells) (A), 100 nM Cs (B), 400 nM 8Ac-Cs (C), 400 nM [14C]8Ac-Cs (D), 200 nM 6CA-Cs (E) or 400 nM 8CA-Cs (F). The concentrations are those where maximal accumulation of cells in G2/M phase was observed. PI, propidium iodide.

