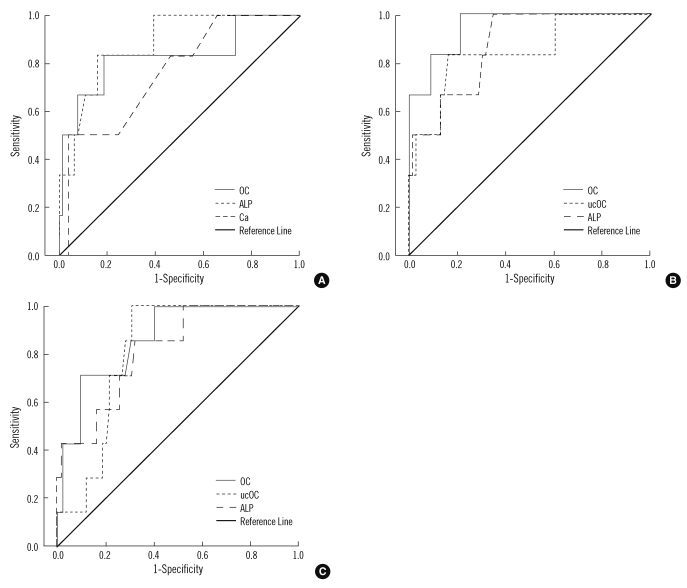
Fig. 4.
ROC curve analysis of biochemical bone markers for osteoporosis. (A) femoral neck osteoporosis (AUC=0.882, P=0.002 for ALP; AUC=0.829, P=0.008 for OC; AUC=0.761, P=0.034 for calcium), (B) L1-4 spine osteoporosis (AUC=0.949, P=0.003 for OC; AUC=0.873, P=0.012 for ALP; AUC=0.845, P=0.021 for ucOC), and (C) L2-4 spine osteoporosis (AUC=0.866, P=0.003 for OC; AUC=0.819, P=0.010 for ALP; AUC=0.814, P=0.011 for ucOC). Abbreviations: AUC, area under the curve; ALP, alkaline phosphatase; OC, osteocalcin; ucOC, undercarboxylated osteocalcin.

