Fig. 4.
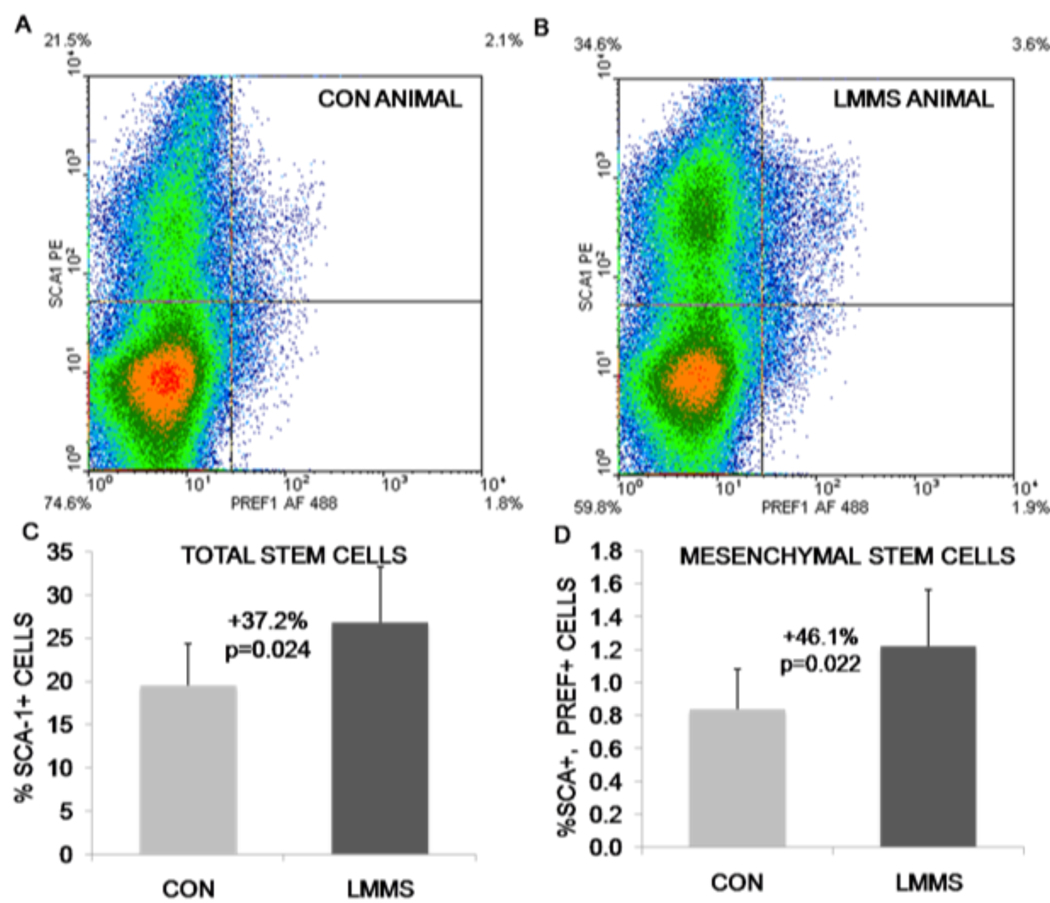
Representative density dot plots from flow cytometry experiments indicate the ability of LMMS to increase the number of stem cells in general (Sca-1 single positive, top quadrants), and MSCs specifically (both Sca-1 and Pref-1 positive, top right quadrant). Red, high cell density; blue, low cell density. Compared with control animals (A), LMMS increase the number of stem cells in the bone marrow of LMMS animals (B). The actual increase in total bone marrow-derived stem cell number (C) and MSC number (D) was calculated as percent positive cells/total cells for the cell fraction showing highest intensity staining. Reproduced from J Bone Miner Res 2009;24;50–61 with permission of the American Society for Bone and Mineral Research.

